Protobuf Tile Server
Working with maps can be amazing, displaying data within maps is one of the trickiest parts when you are developing a platform with geospatial data. A little step to display information in a map is the usage of tiles. In this post we will create a small tile server that will serve protobuf tiles using Node.js, Hapi, Redis and Postgres.
This tutorial was heavily inspired in PostGIS to Protobuf (with vector tiles) please check it out. Keep in mind this tutorial will show a really basic tile server implementation, if you want to find a way more developed and tested implementation you can try TileStache or you may be able to find a lot of great utilities in here. Saying that I hope you enjoy creating your own mini tile server.
Docker and Docker-Compose Setup
Docker will let us create containers and run our project anywhere (as long as the machine supports Docker) leaving aside all the issues of package versions or the cumbersome setup of a database for a simple tutorial like this one. The tutorial will use docker-compose 1.11.2 and Docker 17.03.0-ce, in order to check your version run the following commands:
|
|
Lets start by creating two Dockerfiles in the root directory. The first Dockerfile will be just to create our package.json and npm-shrinkwrap.json, the second one will be the one in charge of starting the tile server.
|
|
|
|
The Dockerfile is self-explanatory we are creating an image with the dependencies we need so our tile server can run but there are a few gotchas within these dependencies:
1.- Mapnik, as the official website states mapnik combines pixel-perfect image output with lightning-fast cartographic algorithms, and exposes interfaces in C++, Python, and Node. We will use this library in order to create the tiles in our server.
2.- The missing package.json and npm-shrinkwrap.json, the reason behind these files not being present at the moment is due to the fact that we want to use Docker and docker-compose to create all files.
Now that we have a Dockerfile we will need to create other containers that will allow an easy development, the first service we will declare in our docker-compose.yml file is a node container. We will be using this container to create the package.json and npm-shrinkwrap.json files. Lets create a docker-compose.yml file in our root directory:
|
|
With this we can run a container which is able to run node, let’s use this container to create our files. Lets build our node container and run the desired commands:
Now if we look in our root directory we will find our two newly generated files, package.json and npm-shrinkwrap.json. The files may have different a different ownership thus causing writing problems, to fix this we can quickly change the ownership by doing the following:
|
|
Lets create a server.js file to test our server container:
|
|
Lets add a container for our server in our docker-compose.yml:
|
|
In our command option we set npm run start-development, currently our package.json lacks this script, let’s add it into the “scripts” field:
We are using nodemon to automatically reload our node server and avoid using ctlr + c and running docker-compose up tile-server for each change in our server files. When changing docker-compose.yml we must restart the docker-compose process using ctlr + c and running docker-compose up tile-server. Create a server.js file to quickly test our configuration:
We can finally test if our setup is working by running docker-compose up tile-server:
Our container works, but the container of server.js is just a console.log. We need a server which will receive http requests, let’s create one with the help of hapijs.
The server
We will be using hapi, to create a simple server. Creating a server with hapi is pretty simple:
Now we can run our server by running docker-composer run tile-server:
|
|
We can test our working server by going to our browser and go to http://0.0.0.0:8081
Amazing, our server works. We will need to connect to a database, in this tutorial we will be using Postgres. Lets create a plugin which will help us connect to a database.
Postgres plugin
In order to connect from our server to a database we will need to add a container into our docker-compose.yml, we will be using an image of postgis:
The tile-server container got new options defined, the links option will link to containers in another service. We need this option so we can communicate with our database, it will also express a dependency between services, which will decide startup order. The depends_on option will start services in dependency order, in our case db will be started before our tile-server. If we run docker-compose up tile-server it will also create and start db.
We now have our server and database, as of now our database is empty. Lets get some example data inserted into our database. In this tutorial we will be using the states from Mexico. The following .sql file will create a schema and a table which will contain all the information we need:
Our database has information and is running correctly, now let’s connect our database to our server by creating a hapi plugin. If you haven’t used hapi plugins please check the docs for more information of how a plugin works.
Create a plugins folder in our root directory and a postgres folder inside it, the postgres plugin will consist of two files a package.json and a index.js. Lets create those files, you should have a structure like the one below:
|
|
The index.js file will contain the logic to connect to our database and create a connection which will be available for later use in our handlers.
|
|
|
|
The plugins array in our server is empty at the moment, we need to include our newly created plugin into the array so hapi will load it.
|
|
As soon as we change the plugins array we should see a reload in our server via nodemon:
|
|
Lets see if everything works out, let’s add a little route to test the connection to our database:
|
|
Go to http://0.0.0.0:8081/postgres-test and check the result, you should see something like this:
Layer plugin
To display a tiled map in a browser usually requires the support of a web mapping framework. This framework handles the retrieval of tiles, display, caching, and user navigation. Popular frameworks for tiled maps include Google Maps API, OpenLayers and Leafet. In this tutorial we will be using leaflet
Most tiled web maps follow certain Google Maps conventions:
- Tiles are 256x256 pixels
- At the outer most zoom level, 0, the entire world can be rendered in a single map tile.
- Each zoom level doubles in both dimensions, so a single tile is replaced by 4 tiles when zooming in. This means that about 22 zoom levels are sufficient for most practical purposes.
- The Web Mercator projection is used, with latitude limits of around 85 degrees.
The de facto OpenStreetMap standard, known as Slippy Map Tilenames[2] or XYZ,[3] follows these conventions and adds more:
- An X and Y numbering scheme
- PNG images for tiles
- Images are served through a REST API, with a URL like http://.../Z/X/Y.png, where Z is the zoom level, and X and Y identify the tile.
Raster tile layers
Raster tile layers deliver basemaps to your client application as image files (for example, JPG or PNG format) that have been prerendered and stored on the server and are displayed as is by the client. Raster tile layers are most appropriate for basemaps that give your maps geographic context such as imagery (as in the World Imagery basemap) or feature-based maps such as in the Topographic, National Geographic, Oceans, and other basemaps. Raster tile layers can also be composed of static operational layers such as thematic maps of your data.
The tile layer format is fast to transmit over the Internet and is easily understood by most common mapping software applications, so these basemaps are compatible not only with ArcGIS and web apps built with the ArcGIS APIs, but also third-party apps that use OGC protocols such as WMS/WMTS. Other benefits of raster tile layers include the following:
- Work well across a wide range of applications and devices (web, desktop, and mobile), including desktop applications like ArcMap and older versions of web browsers.
- Provide high-end cartographic capabilities such as advanced label placement and symbology.
- Support various raster data sources such as imagery and elevation data.
- Can be printed from web mapping applications.
Vector tile layers
Vector tile layers deliver map data as vector files (for example, PBF format) and include one or more layers that are rendered on the client based on a style delivered with the layer. Vector tiles include similar data to that found in some (but not all) of the available raster tile basemaps, but they store a vector representation of the data; that is, geographic features are represented as points, lines, and polygons in a format understood by the client application. Unlike raster tile layers, vector tile layers can adapt to the resolution of their display device and be restyled for multiple uses. Vector tiles have a smaller file size than raster tiles, which translates to faster maps and better performance. The combination of tile access performance and vector drawing allows the tiles to adapt to any resolution of the display, which may vary across devices.
In the map viewer, client-side drawing of vector tiles allows you to customize the style of the vector tile layer and the contents of the map. Other advantages of vector tile layers include the following:
- Can be used to generate many different map styles using a single set of vector tiles. You can customize vector tile layers—for example, hide their visibility, change symbols and fonts, change languages for labels, and so on—without having to regenerate tiles.
- Look great on high-resolution displays (for example, retina devices) that offer much better resolution than low-resolution (96 dpi) raster tiles, without the need for generating separate, high-resolution versions. Vector tiles can be displayed at any scale level with clear symbology and labels in desktop applications such as ArcGIS Pro.
- Can be generated much more quickly, and with fewer hardware resources, than corresponding raster tiles. This reduces the cost to generate the tiles and improves the speed at which data updates can be made available.
- Vector tiles are much smaller in size than corresponding raster tiles, reducing the cost to store and serve the tiles.
- Can be projected into various coordinate systems, using desktop applications like ArcGIS Pro, without distortion of labels and other symbols.
You can add vector tile layers as operational layers or basemaps to the map viewer or scene viewer. You can use maps and scenes with vector tile layers in web apps using a configurable app, Web AppBuilder, or ArcGIS API for JavaScript. Vector tile layers have the best performance on machines with newer hardware, and they can be displayed in Internet Explorer 11 and later and most other current versions of desktop browsers, including Chrome, Firefox, and Safari.
Add more from here https://www.mapbox.com/vector-tiles/.
Now that we understand a little bit more about vector tiles, let’s understand how we will request the tiles to our server. As mentioned before to display tiled maps we require a web mapping framework, at the moment we will use leaflet to display our vector tiles. As of version 1.0.3 leaflet does not allow to load and display vector tiles by using their API. This could be a problem, but thanks to the great effort of contributors and the leaflet plugins system we will be able to render our vector tiles. We will be using the Leaflet.VectorGrid library.
Lets create a html file which will help us render our map. In order for hapi to serve static assets we will need a plugin, inert will help us with this requirement.
|
|
Add inert to our plugins:
And create an index.html file in our root directory:
We need a route to serve this html, let’s add this to our server:
By going to http://0.0.0.0:8081/test-vector-tiles we should see our leaflet map. If using Google Chrome you can open the DevTools and go to the Network tab, select the Img filter and you will be able to see the requests to the carto content delivery network:
As you can see a request was made with the {z}/{x}/{y} format, let’s try to create a handler that follows this format.
With a working database available, we will proceed to create our layers plugin. In our plugins folder create a layers folder, as our postgres plugin the layers plugin will consist of two files a package.json and a index.js. Lets create those files, you should have a structure like the one below:
|
|
At the moment our layers plugin will contain a simple console.log:
|
|
|
|
And include in our plugins array:
As soon as we change the plugins array we should see a reload in our server via nodemon:
|
|
Lets create a layer folder in our plugins/layers/ folder and create a states.js file:
|
|
Lets try to find out what is happening in the handler, keep in mind that this handler will run for each tile in the bounding box.
We are importing the sphericalmercator package, which will help us by providing projection math for converting between mercator meters, screen pixels (of 256x256 or configurable-size tiles), and latitude/longitude.
Next we are declaring a query, we will be using two functions. The first function is st_intersects which returns TRUE if the Geometries/Geography “spatially intersect in 2D”. You may be tempted to use ST_CONTAINS or ST_Within but we must get all the polygons that intersect a given polygon.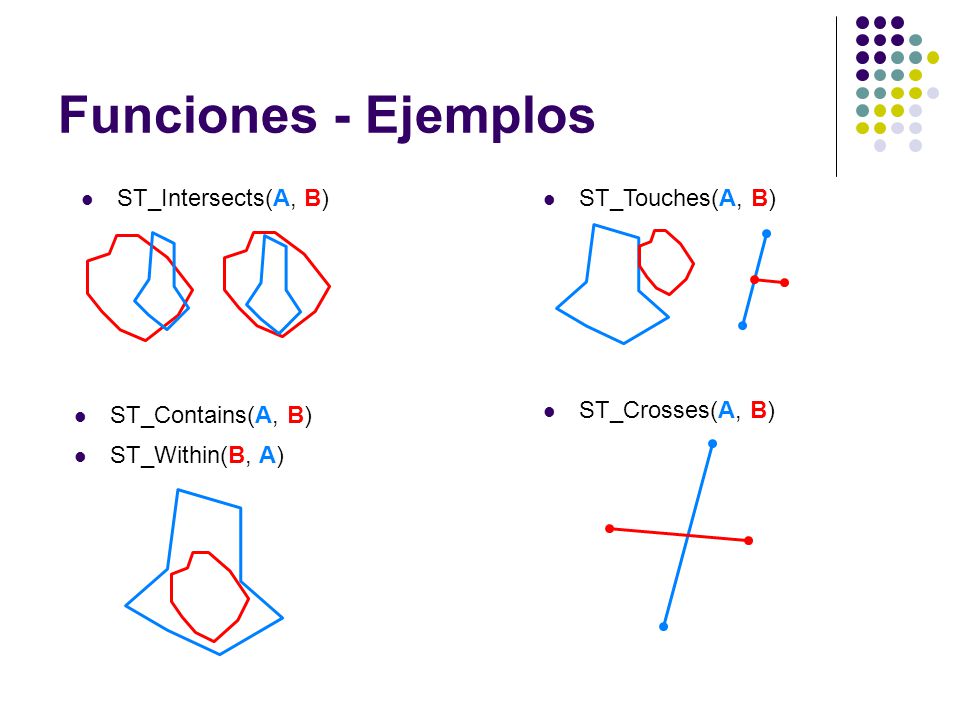
The second function is ST_MakeEnvelope, this function creates a rectangular Polygon formed from the minima and maxima. Remember that this handler will run for each tile in the bounding box, so the polygon that we will form will be just the tile.
We are basically saying get me the topojson and cve_ent fields from the table estados where the the field geom intersects with the rectangular polygon we provide.
Now let’s get the request params (which will be our xyz values from the tile rendered) and use them to convert to bbox of the form [w, s, e, n]. The bbox method has the following signature bbox(x, y, zoom, tms_style, srs) the first three parameters are from the tiles xyz format, the tms_style will decide whether to compute using tms-style and srs will set the projection for resulting bbox (WGS84|900913).
Now that we have a way to create our polygon via the ST_MakeEnvelope function, let’s run our query. The query resulting mask any has the following signature db.any(query, values) so let’s pass our query and the values as an array from our recently created bbox via the sphericalmercator package and reply with the query result.
We have a working handler but we are still missing a route that will execute this handler. Lets go into our index file at our layers plugin folder and register our route:
Now if we go to http://0.0.0.0:8081/layers/states/7/28/56.pbf we should get a response like the one below:
|
|
So what is happening? We are getting al the polygons that are intersected by the tile polygon. We can say that at the zoom level 7 tile index 28, 56 there are 10 states that intersect the tile polygon. This is a little step to return a vector tile but at the moment we are just returning a json response. We will use mapnik to create our tile:
|
|
We are requiring the path and mapnik modules. Mapnik supports a plugin architecture which allows access to a variety of formats, we need to let our mapnik configuration that we’ll be using geojson as a format. Registering geojson.input via registerDatasource will allow us to use GeoJSON as format within the mapnik module. We have just declared our dependencies for the tile creation, now let’s create a function for the creation of our tile:
|
|
First we are creating a new vector tile by using the mapnik’s tile generator, which will build a tile according to the Mapbox Vector Tile specification for compressed and simplified tiled vector data. We are requesting topojson data in our query to reduce the data transfer size, the API for the VectorTile object doesn’t won’t accept topoJSON. We will need to transform each topoJSON into a valid GeoJSON, we will use the topojson module to achieve this task. When we have a valid FeatureCollection we may add it to the tile we created by using the addGeoJSON method. Amazing, a tile was created, still we need to compress the data:
|
|
The getData method will retrieve the data in the vector tile as a buffer, the signature is the following getData([options], callback), we can tweak the options a little but the defaults should work smoothly. The second parameter is a callback which allows this task to be done in an asynchronous way. We get the data from our tile as a buffer, we just need to compress it. The zlib deflate will compress the buffer we received from the getData method, the signature for the deflate method is deflate(buf[, options], callback) the first parameter being the buffer and the second one being the callback, so yeah this method is also asynchronous. Since both methods are async we will wrap them in a Promise. Finally we just need to set the headers into our reply interface:
|
|
Our states.js file should look like this at the moment:
With all this we can simply test with curl if our endpoint works:
The endpoint works and serves vector tiles as protobufs, now we just need to display them in our index.html file:
Lets go to http://0.0.0.0:8081/test-vector-tiles and we should see our tiles working in our maps. Amazing, the styling can be achieved by including properties in your GeoJSON responses by making a join in your query, something like this:
In your parse function you would have to pass the fields you want into the properties object:
And define a function to style the features based in the desired properties:
We have working tiles with the ability of changing styles easily, if we remember correctly at the beginning of the tutorial we mentioned that we were going to use redis. Lets create a redis plugin to reduce the calls to our database.
Redis plugin
Redis is an open source (BSD licensed), in-memory data structure store, used as a database, cache and message broker. Redis is not a plain key-value store, it is actually a data structures server, supporting different kinds of values. What this means is that, while in traditional key-value stores you associated string keys to string values, in Redis the value is not limited to a simple string, but can also hold more complex data structures.
One of the complex structures are binary-safe strings, we will use them to avoid unnecessary database calls. In certain use cases the tile information won’t change in a certain period of time and in order to save resources we can store the result of our handlers with redis.
A redis server is not present in our current configuration, let’s add it to our docker-compose.yml
Create a redis folder within our plugins directory and create a index.js and package.json file.
|
|
We are using bluebird.promisifyAll in the redis module, which as the documentation explains; promisifies the entire object by going through the object’s properties and creating an async equivalent of each function on the object and its prototype chain. The usage of Promises will help us deal with redis in a much cleaner way. We also included a way to clean our cache via http, of course this endpoint should be only exposed in development or protect the endpoint.
|
|
Don’t forget to register our plugin into our array of plugins:
Lets use our redis server through our plugin:
We declare a new function which will take care of caching our binary using redis. Now we have to first check if the key exists withitn our cache, getAsync will take care of that. If we find the key in our cache we create a buffer from our stored binary-safe string and use our replyProtoBuf function to return the desired value. In case we didn’t find our key in redis we follow the procedure to create our tile but including the additional setTileInCache function in the promise chain.
Lets check the results:
|
|
The redis usage allows us to reduce quite a bit the response time from our server.
Useful Links
- https://nodejs.org/api/zlib.html#zlib_zlib_deflate_buf_options_callback
- https://github.com/SpatialServer/Leaflet.MapboxVectorTile/blob/master/docs/configuration.md
- http://mapnik.org/documentation/node-mapnik/3.5/#VectorTile
- https://github.com/Leaflet/Leaflet.VectorGrid
- http://frankrowe.org/posts/2015/03/17/postgis-to-protobuf.html
- http://www.datavizcatalogue.com/index.html
- https://www.mapbox.com/vector-tiles/specification/
- https://github.com/mapnik/mapnik/wiki/PluginArchitecture